4.2.4. Visualization
The raw map created cannot present much in terms of visualization of the data in an intuitive way. Therefore, the visualization options must be selected carefully for each layer. In this example, a number of steps are followed:
- Right clicking on the map ‘Who:InitialConsonant’ and then selecting the ‘Edit Map’ menu brings forward the ‘Map Editor’ dialog, where a number of tabs can be used to edit map information. The visualization options can be set in the ‘Data’ Tab.
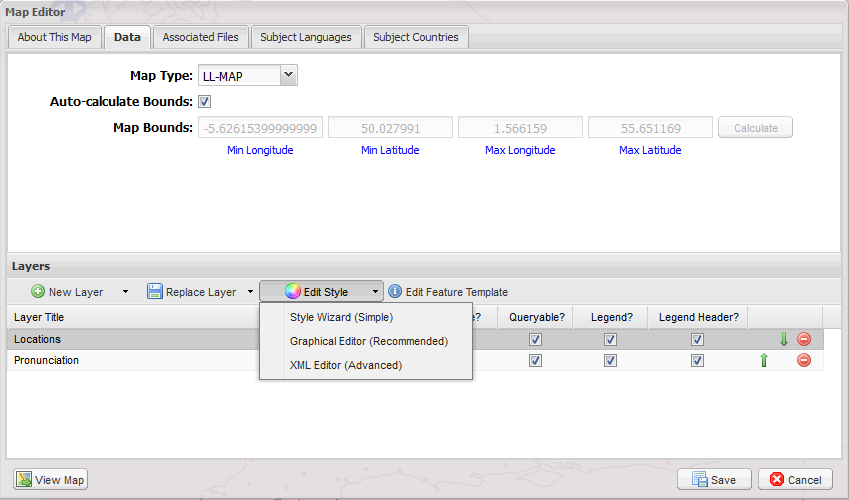
Figure: 21
- There are three different options for editing the style of each layer. In this example, the two options ‘Style Wizard (Simple)’ and ‘Graphical Editor (Recommended)’ are used, while the ‘XML Editor (Advanced)’ is suitable for expert users, with, probably, programming knowledge.
- The ‘Style Wizard’ helps to create a set of color codes for the language features, which can then be edited and modified using the ‘Graphical Editor’.
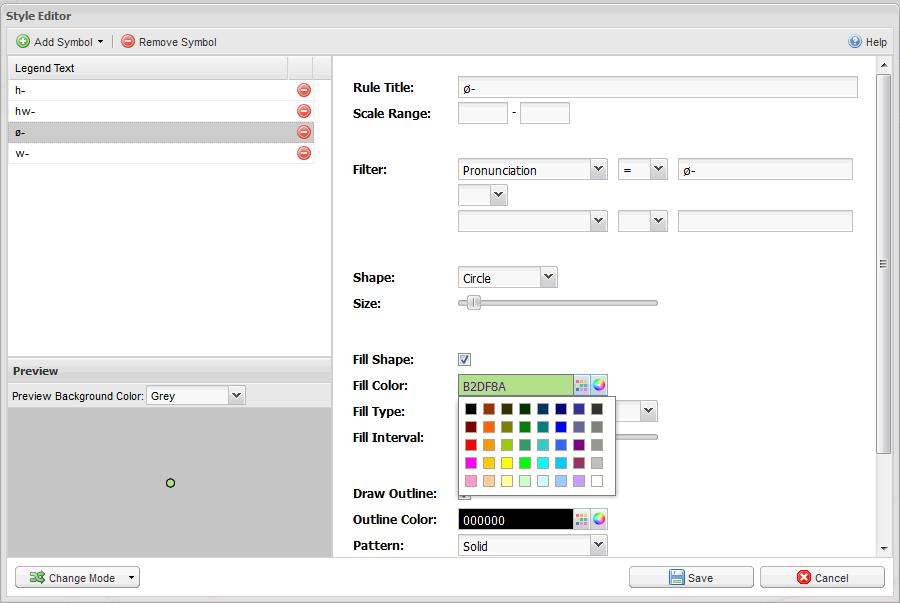
Figure: 22
- In this way, the red dot for the location label is completely removed, and circles with different colors are set for the four pronunciations of the initial consonant of who.
- The resultant map is refreshed when the map name at the left pane is selected.
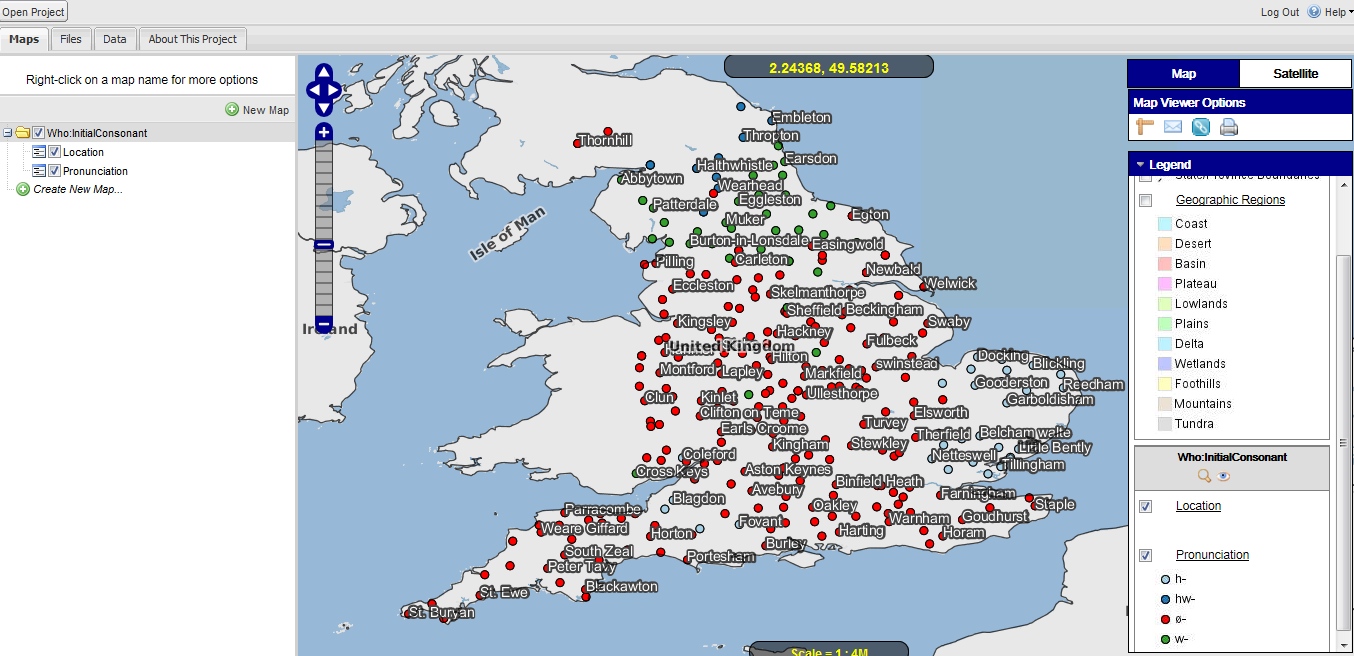
Figure: 23
- Different layers can be chosen to visualize by selecting the check boxes in the bottom part of the ‘Legend’ pane. For example, if the ‘Location’ layer is deselected, the map only shows the dots corresponding to the pronunciations, removing the labels, i.e., the names of locations. Similarly, deselecting the ‘Pronunciation’ check box removes the colored dots.
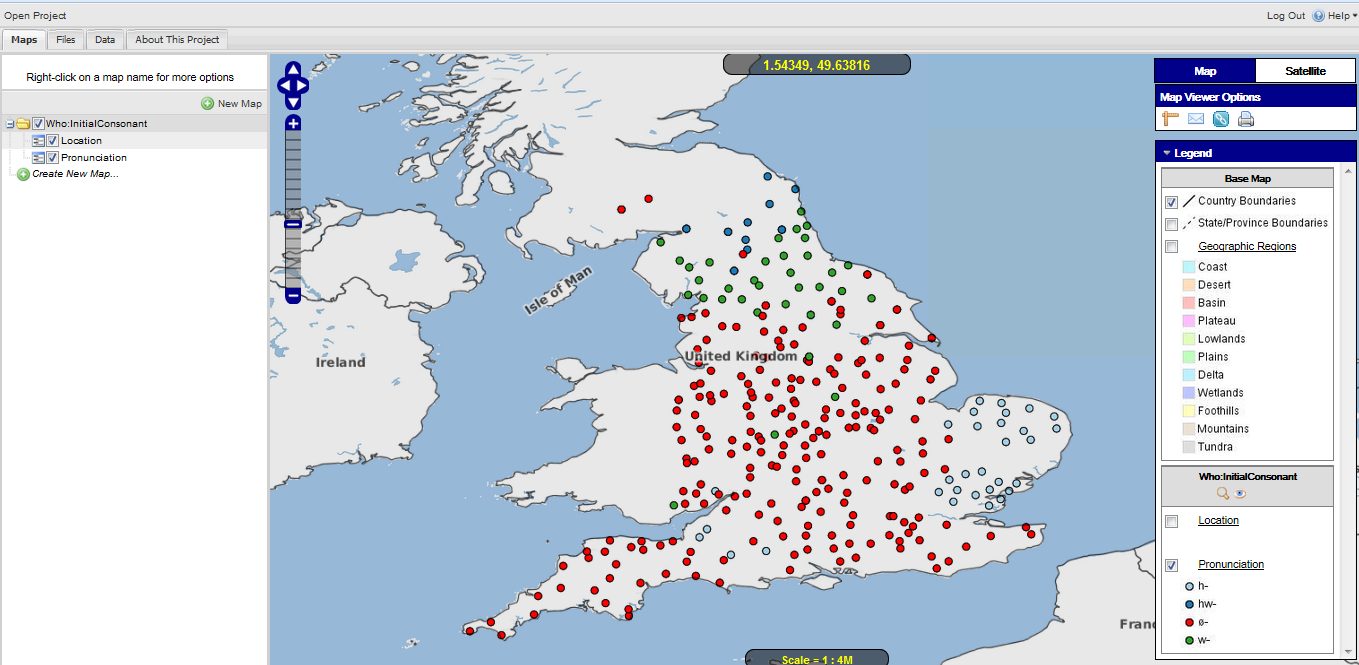
Figure 24
LL-MAP also provides a default set of layers to visualize. For example country boundaries, province boundaries and different geographic reasons can be selected or deselected to view along with the user-defined layers. It is also possible to define the default map bounds and then zoom to that bounds with right mouse click on the map name. However, this exemplary project focused more on the basic features of the mapping software, and therefore, more advanced options are not investigated.
Created with the Personal Edition of HelpNDoc: Free CHM Help documentation generator