4.2.3. Creating the Map
The map can be created following a step-by-step procedure:
- The first step is to login to the LL-MAP website. Accounts can be created free of cost.
- The ‘Workbench’ tab on the home page or the link http://llmap.org/workbench.html is directly accessed.
- In the new opened dialog the ‘New Project’ button is clicked on. This opens a project wizard, where ‘Title’, ‘Contact Name’, ‘Contact Email’ and ‘Abstract’ can be put in. In the next wizard a description of the project can be entered. Afterwards, the ‘Yes, I’d like to run the new Map Wizard now’ option is selected and the ‘Create Project’ button is clicked.
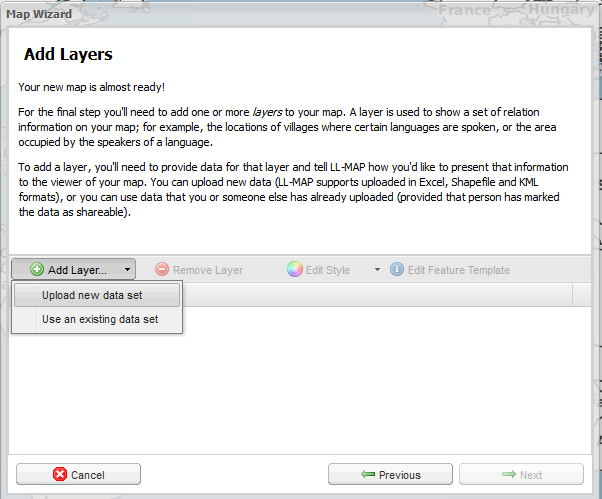
- A project may contain a number of different maps. After creating the project, maps are to be added. In the present example only one map is added to the project. The new ‘Map Wizard’ offers a self-explanatory step-by-step dialog for entering information regarding the map. Thus, the dialog for one of the most important tasks, i.e., adding layers to the map, is reached.

Figure: 17
- In this example, a new data set is uploaded from the computer by clicking on the menu item ‘Upload new data set’. The file selection dialog offers the possibility of uploading up to four files simultaneously. However, this is supported only for shape files. In this example, an Excel spreadsheet (.xls file) containing the language data is uploaded. For this file format only a single file can be uploaded for a particular layer.
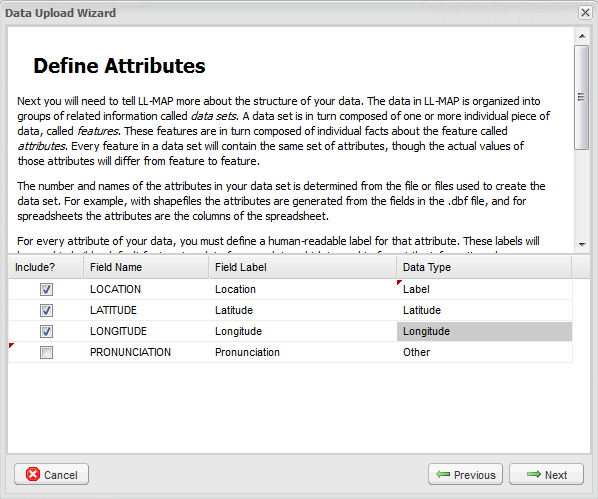
- An Excel file may have a number of different worksheets. Therefore, LL-MAP offers the possibility of selecting the specific worksheet. The next dialog helps to select the columns as data fields and the data type for each of them.

Figure: 18
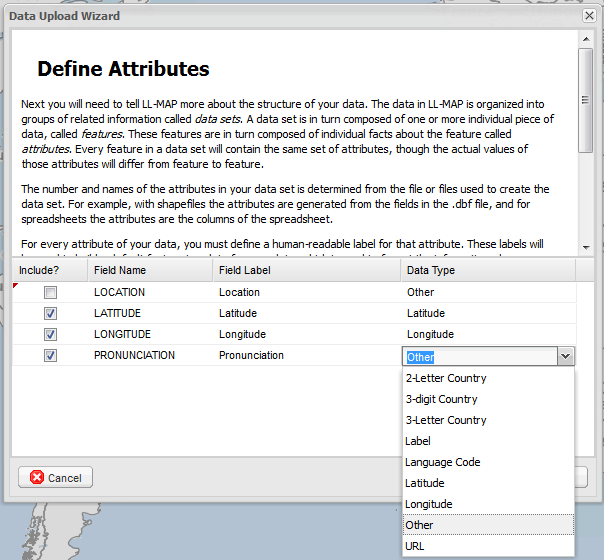
- The first layer is designed for providing the names of locations as labels. Thereore, the fields ‘LOCATION’, ‘LATITUDE’ and ‘LONGITUDE’ are selected. The corresponding data types can be selected from a drop down list. Afterwards, basic information like ‘Name’, ‘Category’ and ‘Description’ of the data set is entered to create the layer.
- A second layer is created in the same way by selecting the data fields (columns in the Excel spreadsheet) ‘LATITUDE’, ‘LONGITUDE’ and ‘PRONUNCIATION’. This layer is designed for plotting the initial consonant pronounced for who across England.

Figure: 19
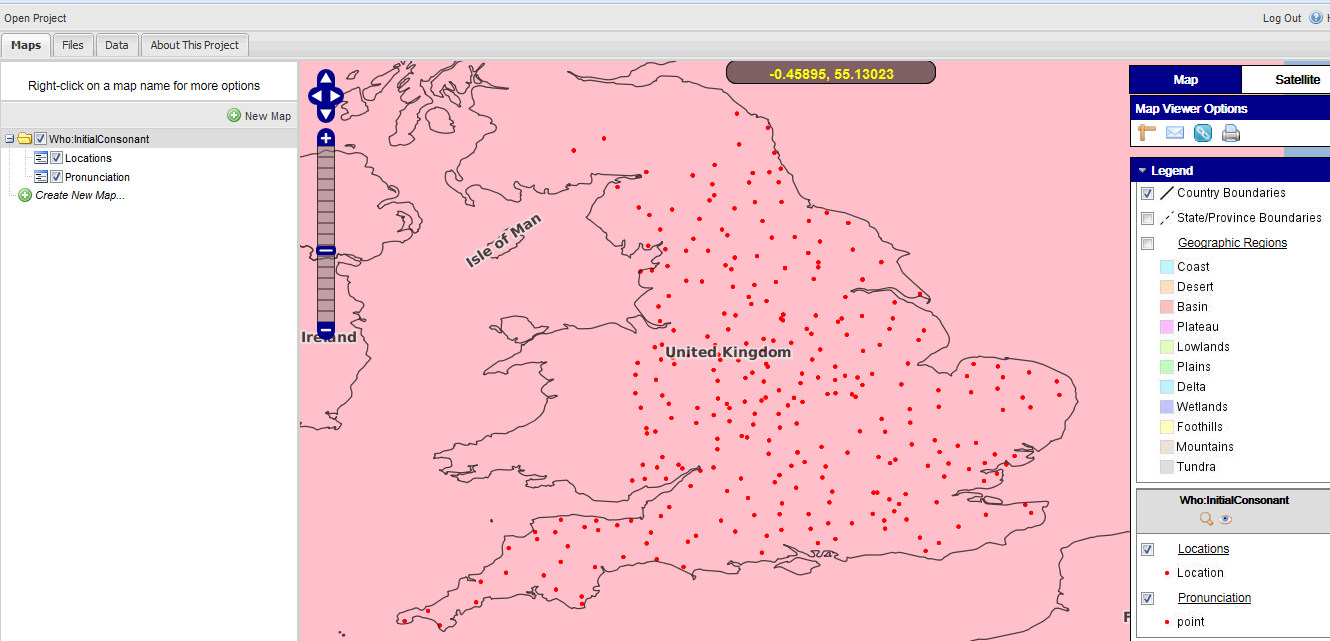
- The above steps create the initial map where all the information is presented as red dots by default. The map is named ‘Who:InitialConsonant’. The map and different layers are later fine tuned for better visualization as described in section 4.2.4.

Figure: 20
Created with the Personal Edition of HelpNDoc: Easy to use tool to create HTML Help files and Help web sites


