4.1.4. Visualization
Google Fusion Tables does not automatically assign the icons for particular location points by default. Every point is mapped as a red dot instead.
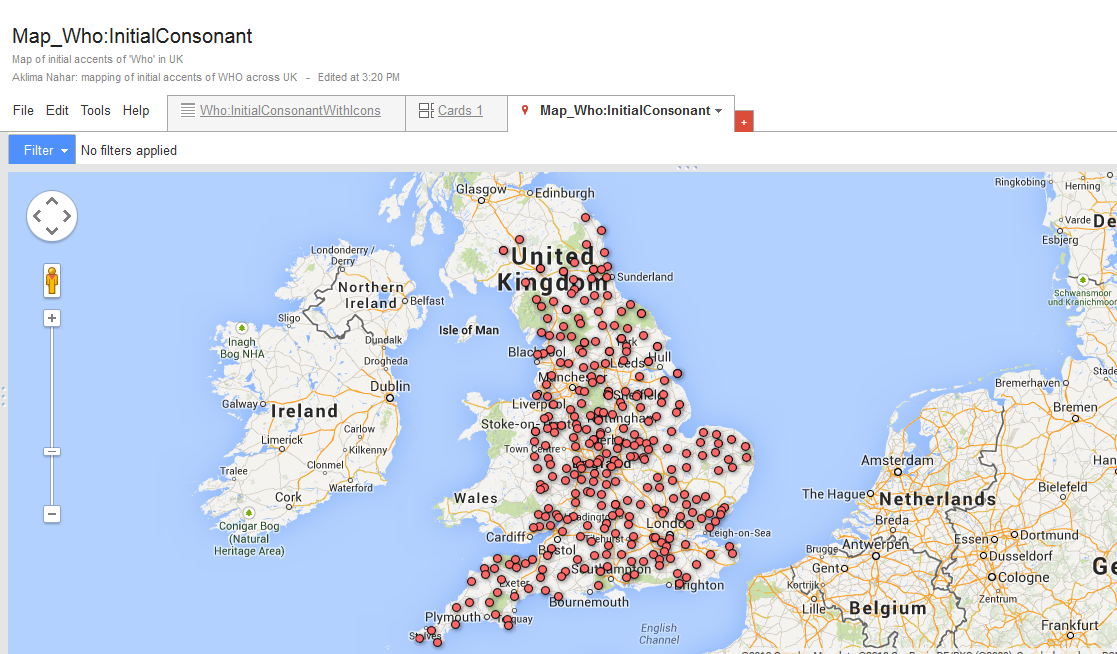
Figure: 12
In order to apply different visualization options the following steps are performed:
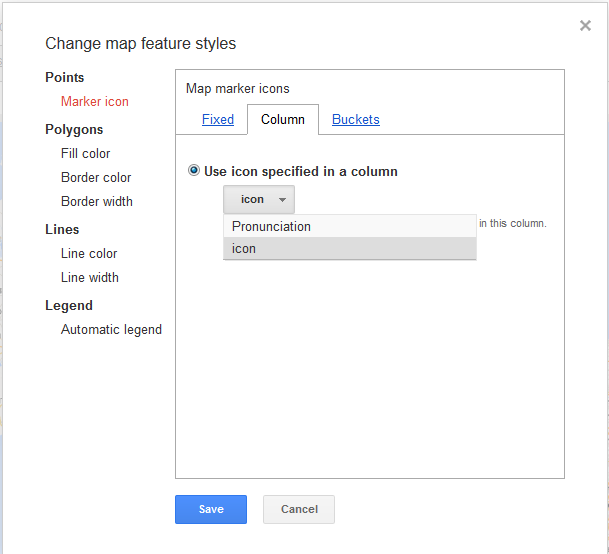
Figure: 13
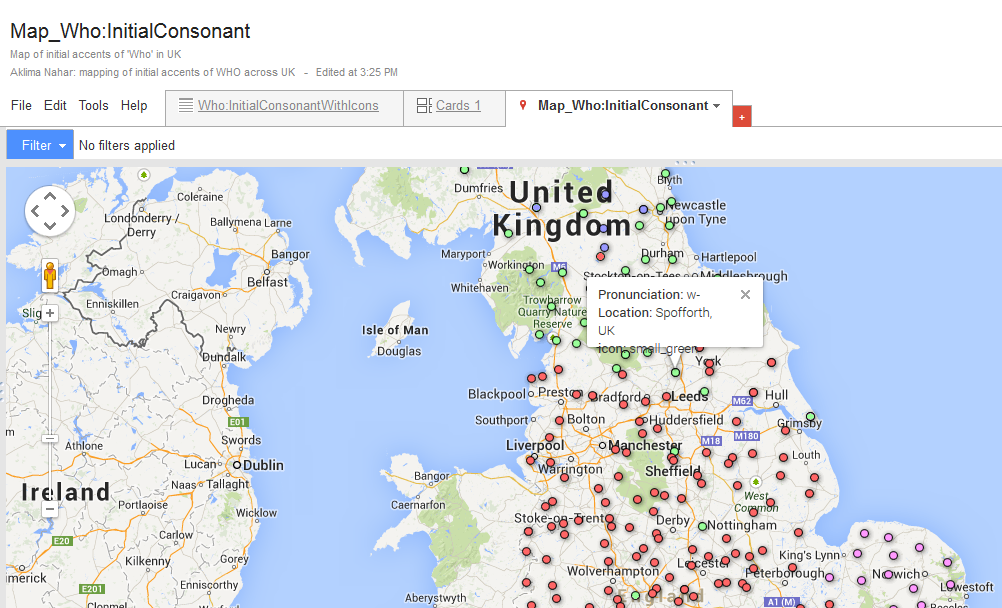
Figure 14
The visualization offers a range of possibilities in terms of geometric shapes and colors for marking points, lines and polygons on the map. In this example only location points are used with the possibility of adding separate icons for different pronunciation of the initial consonant of who across England. Therefore, other visualization options are not investigated further.
It is also worth noting that Google Fusion Tables is an experimental project and it does not directly offer adding different layers, which is an interesting visualization feature for a map. Integrating features like that requires external plug-ins and programming knowledge for using the Fusion Tables API (Application Programming Interface). Such tasks are not considered within the scope of this companion website.
Created with the Personal Edition of HelpNDoc: Write EPub books for the iPad