4.1.3. Creating the Map
The creation of the map is described as a step-by-step procedure:
- Login to the Google account and browse Google Drive.
- Click on the ‘Create’ button to start the process.
- A dialog named ‘Import new table’ appears, which supports importing data. There are three options, namely ‘From this computer’, ‘Google Spreadsheets’ and ‘Create empty table’. The first option is selected in this example and then the ‘Browse’ button is clicked to select the ‘LanguageData’ table. The first row specifies the names of columns and the following 309 rows specify language data, i.e. location against pronunciation.
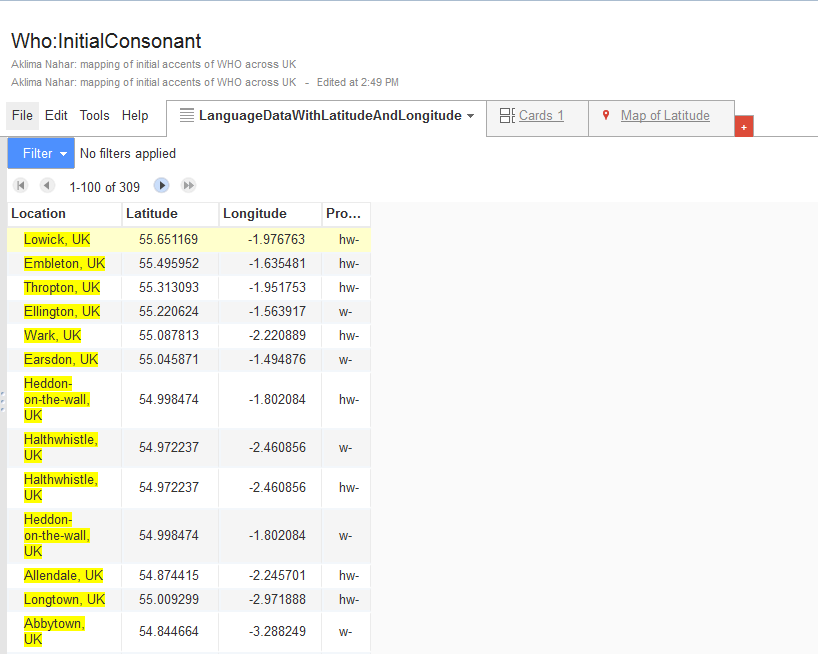
- Clicking on ‘Next’ produces the initial table. Google Fusion Tables is intelligent enough to identify that the table most likely consists of location data and therefore, a map is also automatically generated as a separate tab. Tab names can be easily edited.

Figure: 9
- For Fusion Tables, the ‘Location’ column suffices as the geographic location information. Therefore, the ‘Latitude’ and the ‘Longitude’ columns are discarded by clicking on ‘Tools -> Select columns …’ and then selecting only the ‘Location’ and the ‘Pronunciation’ columns. This result in a table with two columns.

Figure: 10
- The type of data of a particular column can be edited by clicking on the drop down arrow of that column, and then selecting ‘Change…’. There are four options available for the data type, namely, ‘Text’, ‘Number’, ‘Location’ and ‘Date/Time’. For this example, the ‘Location’ type is selected.
- If the ‘Latitude’ and ‘Longitude’ columns had been used for defining the locations, the check box ‘Two column location’ must be checked for associating the columns for latitude and longitude.
- The ‘Pronunciation’ data table is also imported in a similar way. Since this table does not contain any location information, no map is automatically generated.
- The next step is to merge the two tables, ‘LanguageData’ and ‘Pronunciation’. This is done by clicking on ‘File -> Merge…’ and then selecting the table to merge. After selecting the table, the connecting columns in each table are identified as source of match. In this example, both tables have the column ‘Pronunciation’ and it is selected as the connecting column.

Figure: 11
- Only three columns, namely ‘Location’, ‘Pronunciation’ and ‘Icon’ are selected to be viewed in the merged table. After clicking on ‘Next’ and then ‘Merge’ the merged table is created and a link is also generated.
- Clicking on the link or ‘View table’ button calls up the dialog which offers the option for providing table information. When the ‘Save’ button is clicked on the dialog, Google Fusion Tables starts automatically geo-coding the ‘Location’ column of the merged table.
- After the above process is finished, the map contains all the required data and it is ready for setting visualization options.
Created with the Personal Edition of HelpNDoc: Easy to use tool to create HTML Help files and Help web sites


