4.1.2. Creation of Data Tables
The language data used on this webpage for mapping in Google Fusion Tables is organized in two separate tables:
Pronunciation against Geographic Location
This data table corresponds to the map ‘WHO: INITIAL CONSONANT’ as presented on page 93 of the Atlas of English Sounds (Kolb, Glauser, Elmar and Stamm 1979). A list of localities (e.g., Lowick, Embleton, Thropton, Ellington etc.) is also presented separately in the book. The names of localities are listed in the column ‘Location’ of the Excel spreadsheet created in this work. The map on page 93 is then investigated to list the pronunciation, namely [hw-], [w-], [h-], and/or [ø-] for each location, as a new column ‘Pronunciation’ in the spreadsheet. If a particular location is assigned more than one pronunciation, a new row is added duplicating the location. In this way a total of 309 rows are obtained in the spreadsheet.
Google Fusion Tables attempts to automatically geocode such names of localities. However, at first attempt it failed to geocode a number of locations because of the ambiguity resulting from the fact that a location name can be present in a number of places. For example, the location ‘Harby’ is found in Denmark, ‘Staple’ in France, ‘Eggleston’, ‘South Clifton’, ‘Kimbolton’ etc. in the USA. In order to solve this problem, the location name is made more specific adding the country name, e.g. ‘Harby, UK’.
Fortunately, the 309 locations used in this work were correctly geocoded after adding the country name as suffix. However, it is possible that a country can have different locations with the same name. Such cases of ambiguities can be resolved by adding the specific geo-coordinate (latitude and longitude) for that particular location.
Geo-coordinates of locations can be found using Google Maps. However, there are other on-line services that help obtaining geo-coordinates of locations in batches. For this webpage, such a service named Batch Geocode is used in order to obtain the latitudes and longitudes for those 309 locations. A screenshot of the graphical user interface of this service is presented in figure 6.
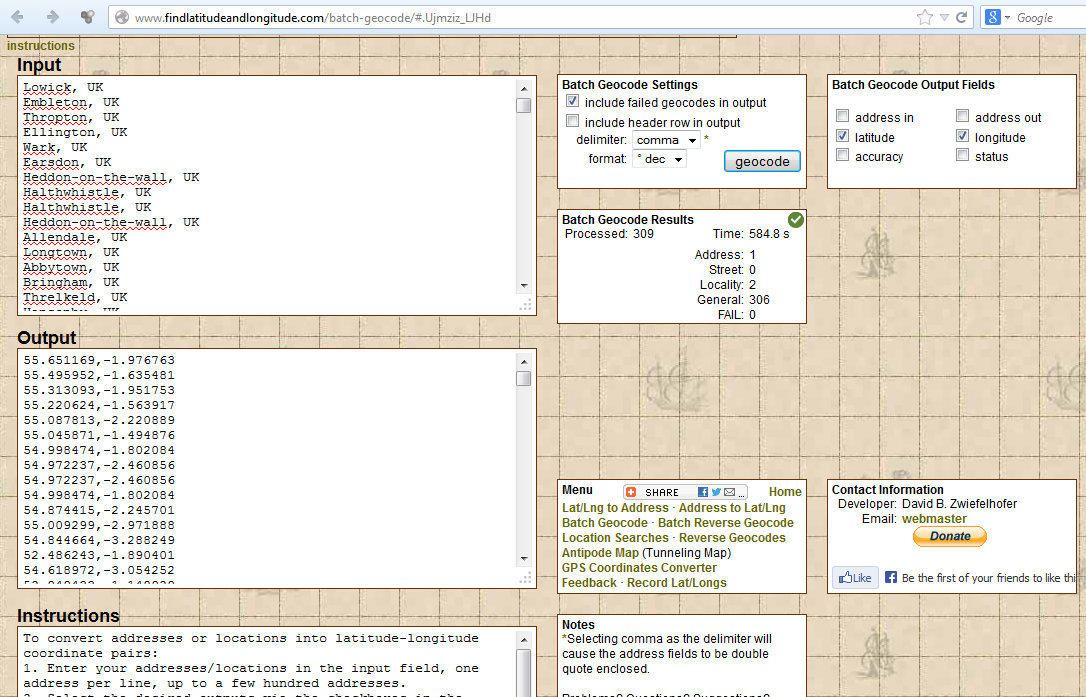
Figure 6: A screenshot showing the graphical user interface of Batch Geocode
The table is then enhanced by adding two more columns ‘Latitude’ and ‘Longitude’ containing the geo-coordinates.
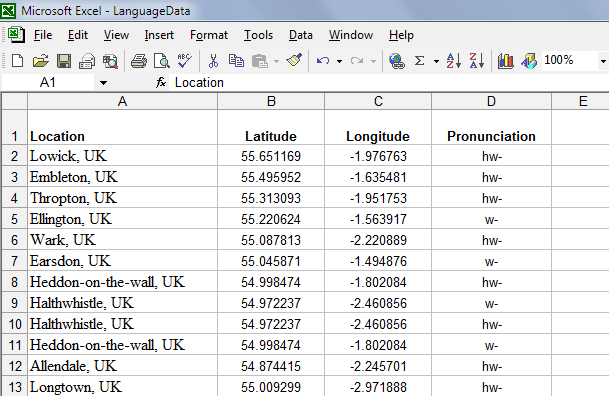
Figure: 7
Google Fusion Tables requires either the ‘Location’ column or both ‘Latitude’ and ‘Longitude’ columns to pin-point the locations.
This data table file is named as ‘LanguageData.xls’ and will be referred to as the ‘LanguageData’ table from now on.
Icon against pronunciation
Google Fusion Tables offers a rich set of icons or map markers to visualize data on maps. The name of an icon can be obtained by clicking on it. In this example, there are four different types of pronunciations, namely [hw-], [w-], [h-], and [ø-]. Each pronunciation is listed against an icon and this table is created as an Excel spreadsheet.
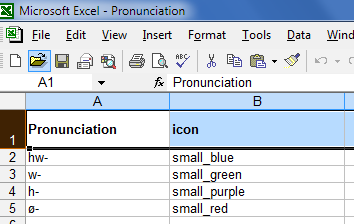
Figure: 8
Alternatively, it would be possible to include all the information, including the icon names, in a single table. However, that would require repeating the icon names for each row in the table. Fortunately, Google Fusion Tables helps avoiding such tedious work by providing the option of merging data tables together. This data table file is named ‘Pronunciation.xls’ and will be referred as the ‘Pronunciation’ table from now on.
Created with the Personal Edition of HelpNDoc: Free HTML Help documentation generator