For a short introduction on how to visualize data we will use a standard dataset located in the default directory. The Krack-High-Tech dataset comes from a study that was conducted with employees of a firm, who were analyzed in regards to networks of advice, friendship and reporting relationships. Furthermore, information in terms of age, tenure, level and department was recorder for each employee.
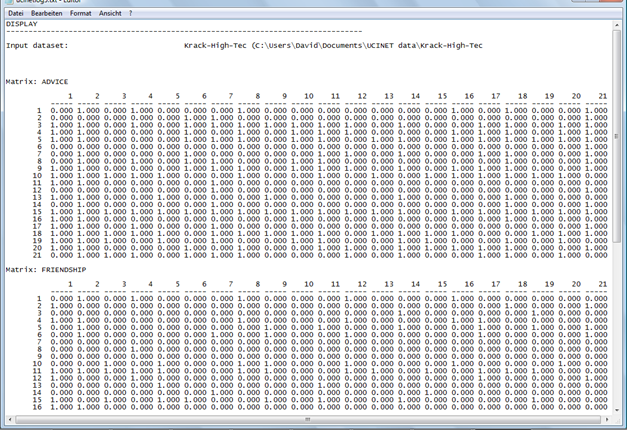
To display the dataset click the display data set button and select Krack-High-Tech. You will see three matrices referring to the respective networks that were investigated in the study (ADVICE, FRIENDSHIP, REPORTS_TO)
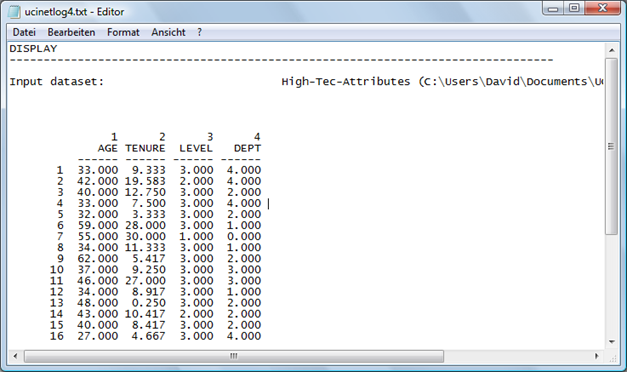
The attribute dataset (which is displayed by clicking the display dataset button and selecting High-Tec-Attributes) shows a matrix of AGE, TENURE, LEVEL and DEPT for each employee.
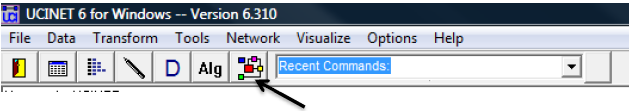
To visualize data click on the NetDraw button on the UCINET toolbar
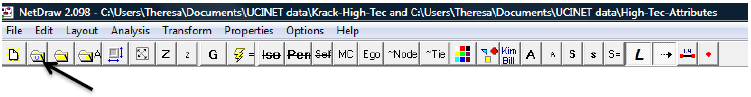
Now click on the second button from the left in the NetDraw toolbar to open the dataset
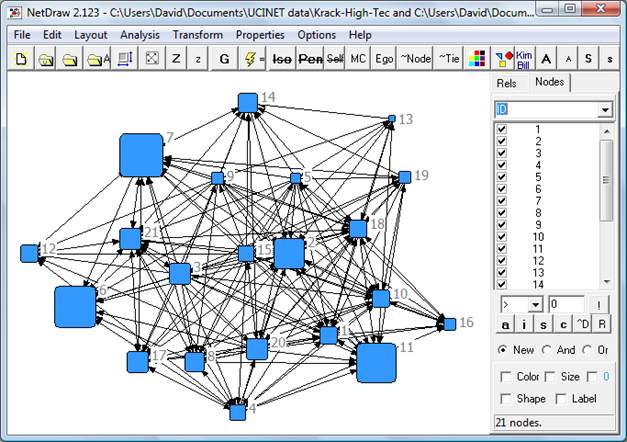
After selecting and opening the respective dataset (Krack-High-Tech) you should see the following network image:
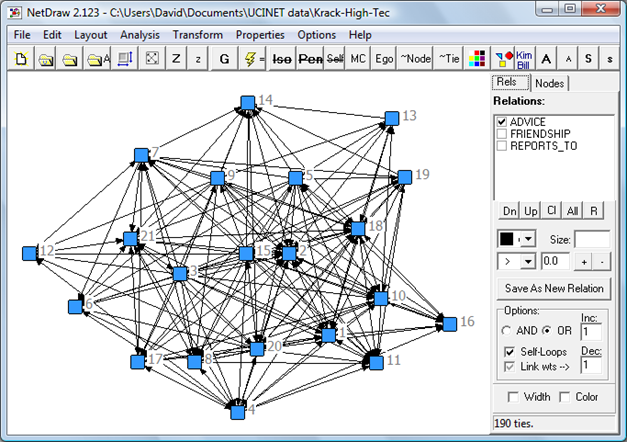
The relations button in the upper right-hand corner offers the option of displaying the respective networks either individually or simultaneously.
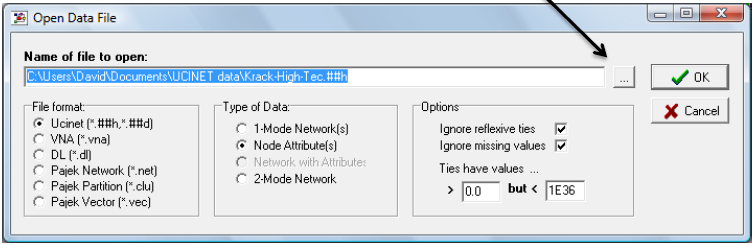
In order to add information about your nodes to your image you will have to open the attribute files. To do so click the fourth button from the left (folder with an A) and click on the box next to where it says “Name of file to open”.
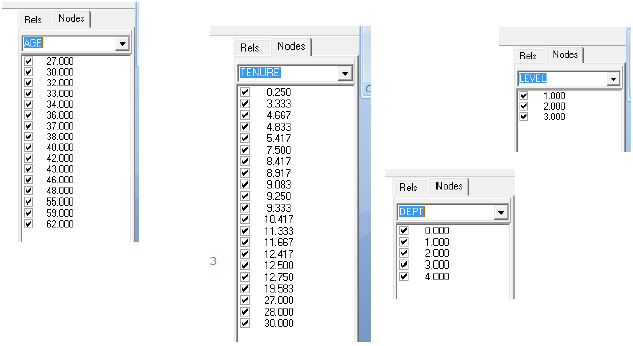
Select High-Tec-Attributes and click “OK”. Now, if you click on the Nodes tab in the upper right-hand corner you can view the attributes available for each node/employee.
Now color, size and shape your nodes according to their attributes.
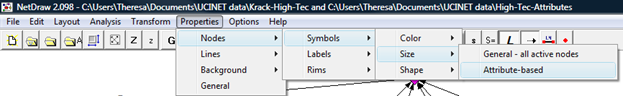
Click on the Properties button above the toolbar. Select Nodes > Symbols > Size > Attribute-based.
The following window will occur:
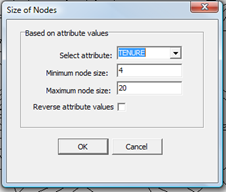
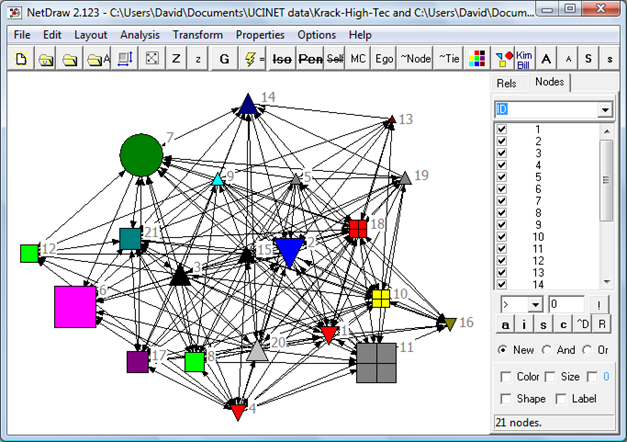
Select TENURE as the attribute. Leave all other options at the default and click OK. The following network image will appear. As you can see below, each node has been sized according to the attribute TENURE.
In order to color and shape the nodes according to the remaining attributes, proceed in the same manner (Properties > Nodes > Symbols > Color or Shape > Attribute-based).
Created with the Personal Edition of HelpNDoc: Produce Kindle eBooks easily