For a data set with one nominal dependent variable and two or more nominal independent variables, a mosaic plot is able to give a clearly structured overview.
> mosaicplot(contingencytable)
Compared to the bivariate mosaic plots we discussed before, the multivariate one in Fig. 15 shows an extremely uneven distribution. The most striking part of the graphic is the predominance of given animate recipients realized as NP (cf. green frame), together with the general majority of given recipients (Baayen 2008: 33).
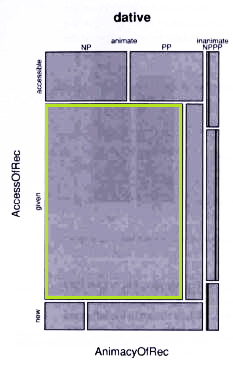
Fig. 15: A mosaic plot for observed counts of clauses cross-classified by the animacy of the recipient, the accessibility of the recipient, and the realization of the recipient (modified after Baayen 2008: 34).
Created with the Personal Edition of HelpNDoc: Full-featured EBook editor