In order to facilitate - and above all expedite - the process of analyzing several hundred text files, we will use a cross-platform, open source Java application named Flesh 2.0 which can be downloaded online and free of charge. (for more information please visit http://Flesch.sourceforge.net/)
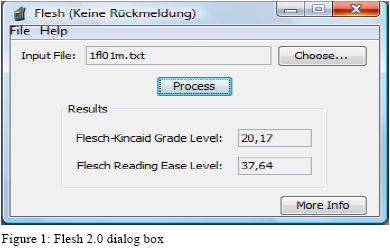
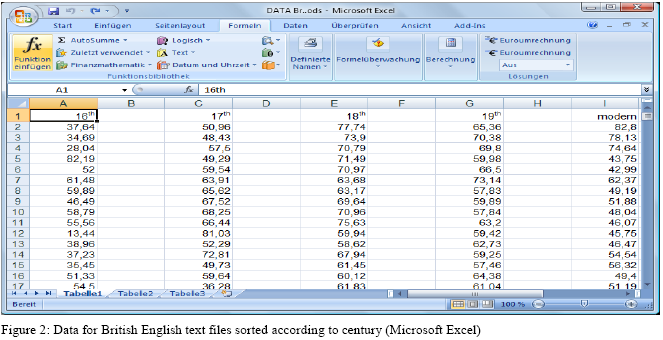
In a first step, we divide the different text files which we retrieved from the historical literature databases into their respective groups according to century and variety. Then we run each file through the aforementioned program, starting with 16th century British English text files, by clicking the Choose…-button and selecting whichever file we wish to analyze. Then, after clicking the Process-button, the program displays both the Flesch-Kincaid Grade Level and the Flesch Reading Ease Level. We are, however, only interested in the latter. For further information on how to use Flesh 2.0 please go to Section 3.3. Using Microsoft Excel we now enter the retrieved figures into their respective columns one by one. This is a somewhat painstaking task, as the program Flesh 2.0 does not allow the user to make use of the copy and paste function. Once the data for one century has been completely recorded, we calculate both the standard deviation and the mean value for each column using the average- and standard deviation function which can be accessed by clicking the Function Wizard (fx) button. The standard deviation is a measure of the average deviation from the arithmetic mean and essentially tells us how tightly the various text files’ Readability Indices (RI’s) are clustered around the mean in a particular century by indicating the measure of dispersion of a random variable’s values from a mean or expected value. It’s underlying formula is the following:
S = 
S indicates the standard deviation, N the total number of results, x means each deviation from the arithmetic mean and  the sum of all squared subtractions (cf. Albert and Koster, 2002).
The standard deviation provides us with valuable information regarding the range of accepted possibilities presenting themselves to the authors within the respective periods in terms of being able to experiment with not yet unalterably fixed norms. This information will be important when comparing our results to the findings of Biber and Finegan. For more information on how to calculate the mean and standard deviation with Microsoft Excel please visit http://www.gifted.uconn.edu/siegle/research/Normal/stdexcel.htm.
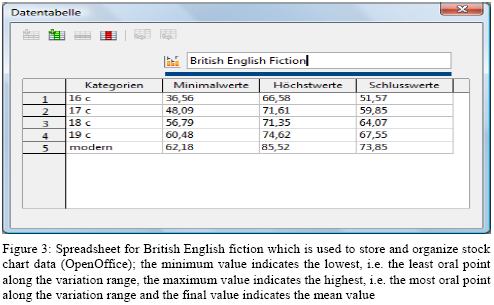
After all the data have been gathered and entered and the respective standard deviations and mean scores for each century and each variety have been calculated, the retrieved information can be visualized. The best way to do this is with the help of so called stock charts, which are available in Microsoft Excel as well as Open Office Calc. As the name implies, these charts are commonly used for stock price data, but can also be used for scientific data. In our case, instead of displaying the price fluctuation for stocks these charts are arranged in such a way that they indicate the Readability Index fluctuation (range of variation) for each century. Stock charts can be divided into the following chart sub-types: High-Low-Close, Open-High-Low-Close, Volume-High-Low-Close and Volume-Open-High-Low-Close. We will use High-Low-Close charts.
High (maximum value) = mean score + standard deviation
Low (minimum value) = mean score – standard deviation
Close (mean value) = mean score
In a final step, we compare our stock chart to Biber and Finegan’s dimension scores for fiction. Aside from displaying the mean scores for each century the authors’ charts also offer information on the range of variation within each period, which according to Biber et al. indicate writers’ tendencies to experiment with new forms.
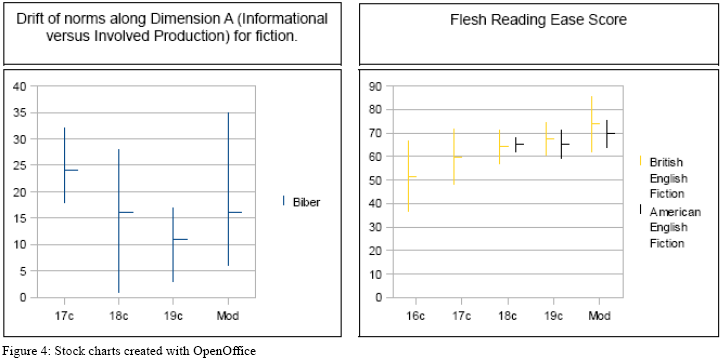
As an analysis of Biber and Finegan’s Dimension A (Informational versus Involved Production) shows, fiction is very involved with a relatively reduced range of possibilities in the 17th century. The following 18th century is mainly characterized by an expanded range of variation which in effect is likely to have led to an informational style with little variation in the 19th century. The modern period resembles the 18th century in that both periods feature a wide range of possibilities and their mean scores are almost identical, with the modern period’s being slightly more oral. In 1989, Biber and Finegan predicted that based on “the expanded range of permissible variation along Dimension A and the direction of change with respect to 19th century fiction, […]fiction in the late 20th century is moving along Dimension A towards more involved, more oral characterizations” (Biber and Finegan 1989: 511). Whether their prediction has proven itself true, is a matter for further investigation, but there is evidence that their assumptions are correct.
As mentioned, unlike Biber and Finegan we have included data for 16th century British English fiction and have distinguished between 18th century, 19th century and modern period American and British English fiction in this study. When comparing our stock chart with Biber and Finegan’s Dimension A (Informational Production versus Involved Production), at first glance, one may assume that aside from the fact that there is an identifiable, general diachronic drift towards a more oral characterization with texts on average featuring less lengthy word and sentence constructions, there is little that these charts have in common.
While Dimension A locates 17th century British English at the furthest “oral” point of the continuum, our data depicts it as relatively “literate” in proportion to the ensuing centuries. Furthermore, its range of variation is relatively wide, while the following 18th century is quite restricted regarding the prevailing norms for fiction. And in general, our results present the aforementioned trend for British English in a much more straightforward fashion with the RI of each century continuously rising towards the oral pole, while Biber and Finegan’s data display a downward trend with a reversal in the modern period.
There are, however, some similarities between Biber and Finegan’s findings and our own. The 19th century and the modern period texts are, for instance, almost identical regarding both range of variation and mean scores in both charts. Also, both data indicate that in comparison with the preceding centuries the modern period exhibits an increase in the range of possibilities. As for the 17th and 18th century, it is uncertain what effectively causes the existing discrepancies; one reasonable explanation may be found in the fact that Biber and Finegan’s multifactorial analysis is based on originally 67 functionally important linguistic features, thus befitting the nature of the aggregate perspective, while this case study focuses on word and sentence length only. On the other hand, Biber and Finegan, for instance, include texts of only two authors from the 17th century in their study, which may of course pose the question of how representative these authors are for their period. In contrast, for the 17th century, we include a total of 145 texts of which 105 have been written by 64 different known authors and 40 have been written by an uncertain number of anonymous authors. Furthermore, as previously mentioned Biber and Finegan do not distinguish between British English and American English. In theory, this could account for the variations regarding the 18th century. The RI mean score for 18th century American fiction exhibits only a slightly more distinct tendency towards the oral pole than the ensuing 19th century, and beyond that our stock chart clearly indicates that American fiction in the 18th century leaves even fewer room for variation than its British English counterpart. As for the remaining periods regarding American English fiction, they show a high level of agreement with both our data for British English fiction as well as Biber and Finegan’s findings. Interestingly enough, contrary to the widely held belief, American English fiction generally tends to be more literate than British English fiction. As opposed to the latter, the American English text files on average feature a greater number of lengthy word and sentence constructions.
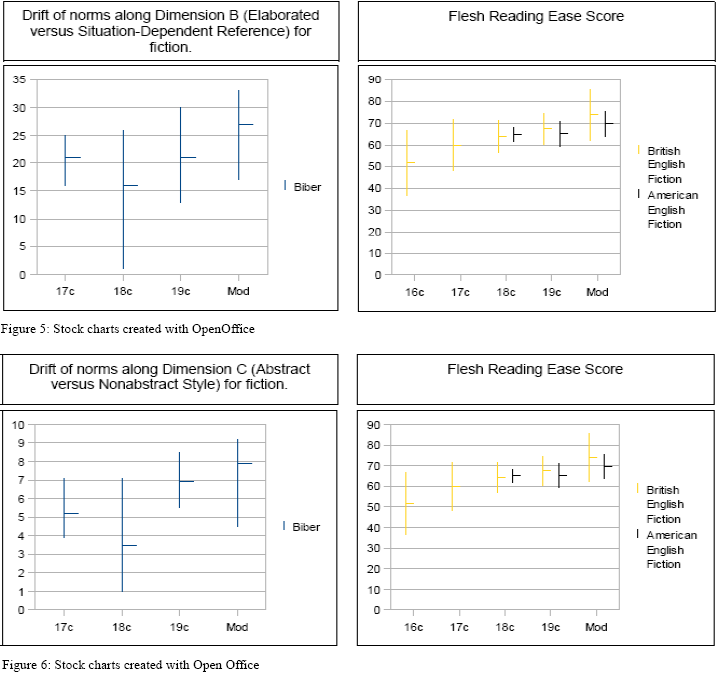
A closer look at Biber and Finegan’s Dimensions B (Elaborated versus Situation-Dependent Reference) and C (Abstract versus Nonabstract Style) clearly illustrates that both parameters more or less follow the same pattern. Obviously, both charts exhibit an overall transition to more oral styles “with the middle centuries being periods of experimentation exhibiting a wide range of literate and oral styles” (Biber and Finegan 1989: 511). The 17th century is relatively situation-dependent and non-abstract, while the 18th century, much like in Dimension A, “represents a period of considerable experimentation, including some texts that are more elaborated than in any other century, but also some texts that are more oral than any found in the 17th century” (Biber and Finegan 1989: 507). The final two periods illustrate a steady rise towards more oral styles, with the modern period allowing for slightly more variation regarding the accepted norm in Dimension C.
As far as our stock chart – repeated her for convenience - is concerned, our findings follow this pattern in much the same fashion, the only exceptions being 17th century British English fiction as well as the 18th century for both varieties. While Biber and Finegan’s results indicate that the 17th century exhibits a relatively restricted spectrum of possible norms, our data show that in terms of width, the range of said century is only matched by the fluctuation margin during the modern period. Furthermore, unlike in Biber and Finegan’s findings which, as mentioned, are characterized by a fall and rise pattern, with the 17th century being far more oral than the following 18th century, our chart displays 17th century fiction as more literate than the ensuing periods. In their article, Biber and Finegan make a point of stressing that “the 18th century was a period of quite fluid norms for fiction […] with respect to elaboration; Figure 8 [Dimension C] shows the same thing with respect to abstract style. In all these cases, the range of variation in the 17th century was quite restricted relative to that of the 18th century” (Biber and Finegan 1989: 507). This statement obviously does not hold true for our findings, which reveal a rather restricted range of variation for 18th century fiction in both varieties. Again, possible differences regarding representativity might serve as a reasonable explanation for such disagreements between the two studies. The remaining two periods, however, resemble each other very much in both studies. Although the range of fluctuation does differ throughout the final periods, both Biber and Finegan’s findings as well as our own indicate a widening of the range of acceptable variation during the modern period.
Created with the Personal Edition of HelpNDoc: Easily create Web Help sites