Before answering the initial question, it is very important to remember how this matrix should be read. Reading off data from this matrix is made difficult by the fact that only the upper half of the matrix is depicted, thus not allowing you to read off complete rows or columns.
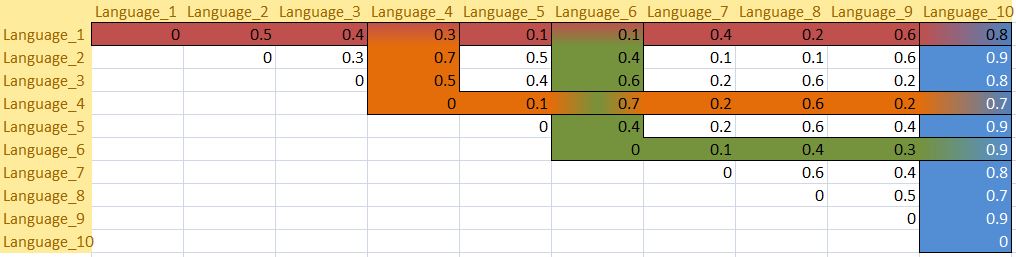
This matrix shows four examples of how to read off data from the diagram.
1. The red shaded cells show how Language_1 compares to all the other items.
2. The orange shaded cells show how Language_4 compares to all the other items.
3. The green shaded cells show how Language_6 compares to all the other items.
4. The blue shaded cells show how Language_10 compares to all the other items.
After looking closely at the numbers there seems to be one odd finding: The distance of Language_10 to all the other items is very high across the board.
This assumption can be confirmed by looking at the different diagrams.
Diagram 1 shows both Language_7 and Language_8 secluded from the rest of the items, something that cannot be said about Language_10.
Diagram 3 shows all items in a relatively uniform array. Although Language_10 is not very close to all the other items, Language_2 also does not seem to be. Looking at the matrix above this cannot be true.
Diagram 2 shows Language_10 heavily secluded from the rest of the array, implying that this might be the correct diagram.
Created with the Personal Edition of HelpNDoc: Easily create iPhone documentation