As a first step, R has to be downloaded and installed. It is available at http://cran.r-project.org/. When starting R, it automatically loads the most important function packages as well. Function packages provide a range of functions that will help with a certain type of data. Before starting the analysis, all function packages needed have to be installed and loaded into R. New packages can be installed with the function install.packages (). If the packages are already installed, but not loaded, they can be accessed through the library () function (Baayen 2008: 23). What is also important to remember is that every time R is closed and one wants to resume work, the packages have to be reloaded. More information about the installation process and the loading of additional packages as well as further basic steps are provided for example in Chapter 3 of Gries (2009a: 19).
For entering data into R, it can be typed in manually with the c() function:
> nameofyourdataset = c(data)
For example (cf. Johnson 2008: 17f.):
> vot01=c(84, 82, 72, 193, 129, 77, 72, 81, 45, 74, 102, 77, 187, 79, 86, 59, 74, 63, 75, 70, 106, 54, 49, 56, 58, 97)
This method is suitable especially for simple data structures, as in this case for example the vector vot01, a one-dimensional array consisting of a collection of values.
Alternatively, and this is what would usually be done for more complex datasets such as tables (in R called matrices) or data frames, the data can be read into R from computer files of a spreadsheet software, as for example OpenOffice.org Calc or MicrosoftExcel. The difference between a table and a data frame is that a data frame can contain elements of different classes, for example numeric and nominal, while in a table all the elements need to be of the same class. In a data frame, each column contains values on one variable and each row represents exactly one data point analyzed (cf. Data frame 1), which is why for editing a data frame it is crucial that the first column should be numbered from 1 to n. Every additional column represents either the data items (here ‘sentence’) or a variable of the data items (here ‘relation’ and ‘length’). Where applicable, another column can be used for annotating information about the source of the data (Gries 2009a: 182).
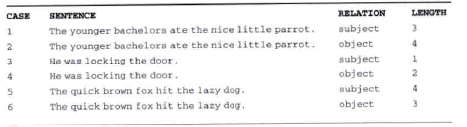
Data frame 1: A suitable data frame (Gries 2009a: 183).
After having created the data frame, click on “save as” and save the file as “tab delimited text”, which has the ending .txt. Load the file into R with read.delim() and check if the file was read correctly by typing the name of the file or using summary()and hitting [Enter] (Johnson 2008: 60f., 72ff.).
Once the data is stored in a data frame and loaded in R, the evaluation of data begins. In case learners have no research data of their own yet, they can use data sets provided online. Baayen (2008) for example works in his book with the data sets and functions available in the language R package, which can be downloaded at http://cran.r-project.org/.
Created with the Personal Edition of HelpNDoc: Free PDF documentation generator